
This is a repost from the figure.openmicroscopy.org blog where its creator Will Moore talks about how OMERO.figure works:
I recently read an excellent guide by Benjamin Names on How to Create Publication-Quality Figures.
It describes the goals of scientific figure creation (accuracy, quality, transparency) and a very thorough workflow to achieve these goals. The key is to understand your data and how it is stored, manipulated and displayed. In particular, it is important to minimise the number of steps where data is transformed and perform lossy steps as late as possible in the figure creation process.
Benjamin documents specific tools that he uses for his workflow such as ImageJ for images and Inkscape for figure layout. But much of his workflow can also be applied to OMERO.figure since it was designed with the same principals in mind.
I highly recommend you read the guide above, as it provides a lot of background information on how computers handle vector and raster data. The steps of Benjamin’s guide that can be replicated in OMERO.figure are described below.
The OMERO server stores your original microscope files and can render them as 8-bit images using your chosen rendering settings. Single-color LUTs can be applied to each channel over a specified intensity range and channels can be toggled on and off. None of these changes will alter the original microscope data. OMERO.figure does not require you to save 8-bit images before creating a figure, since all rendering is done ‘live’ within the figure app itself after importing images, as described below.
OMERO.figure is similar to Inkscape and Adobe Illustrator in that it defines figures in a vector-based format that embeds linked images. This means that moving and resizing images within a figure does not require resampling of pixel data, avoiding loss of image quality.
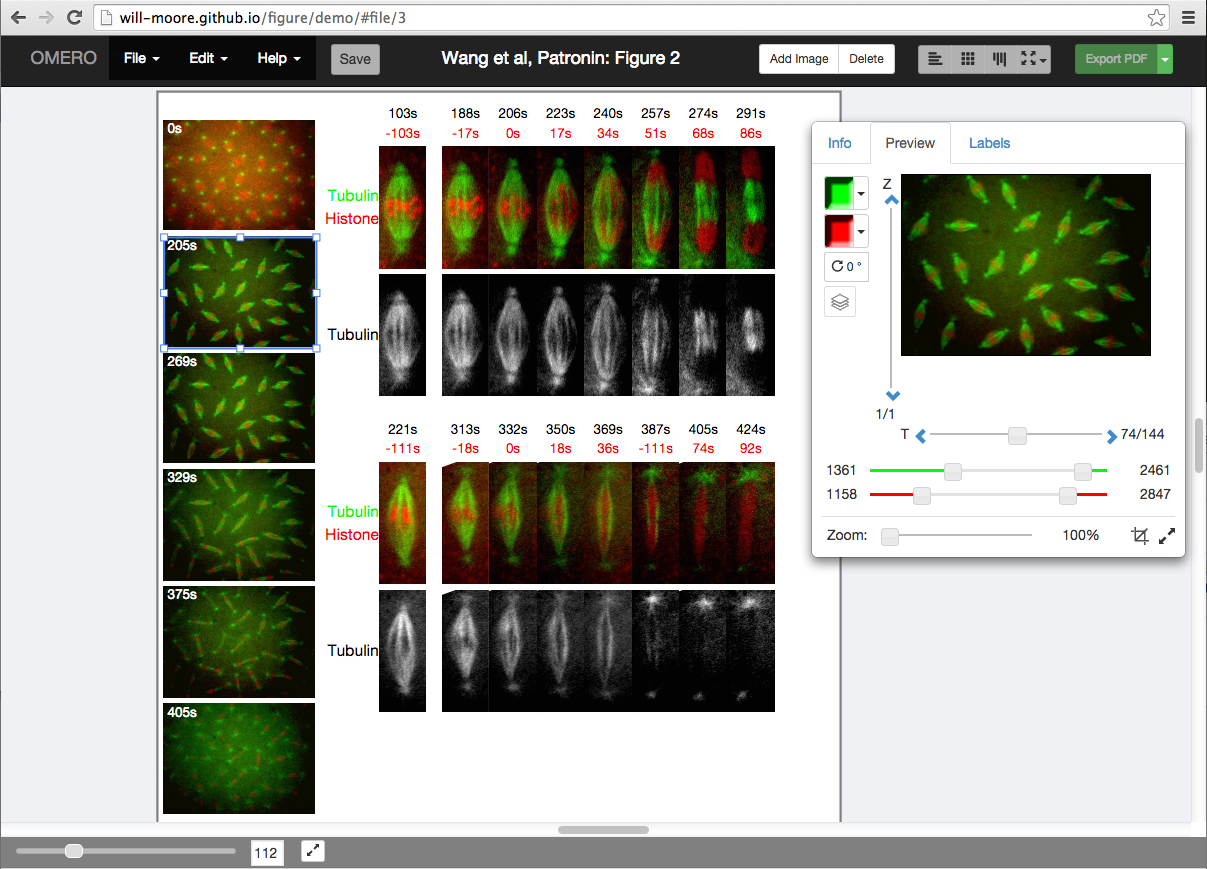
Screenshot: Editing layout and rendering settings in OMERO.figure.
Data from Wang et al JCB 3013.
To add images to OMERO.figure, you simply specify the ID of the image in the OMERO server. The necessary data such as image size, number of channels, pixel bit-depth etc is then imported from the server. You can then edit the image rendering settings while working on the figure layout and these changes are stored in the OMERO.figure file. The file format is a Javascript object (saved as json data) and contains no pixel data. OMERO.figure retrieves rendered 8-bit images from the OMERO.server and assembles them into a figure in the browser as needed.
The resolution (dpi) of images in OMERO.figure is calculated from their size on the page and the printed size of the page itself (which can be edited under File > Paper Setup…). The dpi of each image can be seen under the ‘Info’ tab and will change as the image is resized and zoomed.
Journals usually require all images to be at 300 dpi or above in order to avoid a pixelated appearance when figures are displayed at their published size. If you need to increase the dpi for an image, you can set an export dpi and the panel will be resampled as necessary in the exported PDF.
OMERO.figure allows you to crop images. It uses a ‘clipping mask’ to produce the cropping effect which means you can undo or edit the crop at any time. You can crop by using the zoom slider to zoom the image, then pan to the desired spot, or you can use a standard ‘crop’ tool to draw a crop region on an image.
Scale bars can be easily added to images in OMERO.figure and the known pixel size will be used to calculate the correct length. Scale bars are vector objects overlaid on the image and will be automatically resized if you resize or zoom the image.
OMERO.figure offers export in PDF and TIFF formats. Both are generated on the OMERO server using a Python script and the Python Imaging Library (PIL) for image manipulation. Figures are saved on the server and are then available to download.
Tiff images, at 300 dpi are generated by resampling all the embedded images using a bilinear filter. Vector data such as labels and scalebars is rasterized and overlaid on the image.
The Python script uses the Reportlab library to produce PDF files. Images are rotated, cropped and resampled to the chosen dpi as necessary and saved as TIFFs before embedding in the PDF. Labels and scalebars remain as vector objects that can subseqently be manipulated in other vector-based packages if needed.
An additional option with TIFF or PDF figure export is to export all the embedded images as TIFFs, saved at each stage of the figure generation process:
This option increases the transparency of the image processing steps, and also provides images that can be used for other purposes if needed.
OMERO.figure is a web application that stores figures in a vector-based file format linked to images. By linking to the original microscope images in the OMERO.server, we have complete control over rendering of high bit-depth images within the figure. Only when the figure is exported do we need to save images as 8-bit TIFFs. This pushes the lossy and file-format specific steps to the very end of the figure creation process, ensuring the highest possible quality of images in the final figure.
Thanks to Benjamin Names for his original guide which provided the basis of this article.
(Originally published on April 30th 2015)
— February 8, 2018

© 2005-2026 University of Dundee & Open Microscopy Environment. Creative Commons Attribution 4.0 International License
OME source code is available under the GNU General public license or more permissive open source licenses, or through commercial license from Glencoe Software Inc.
OME, Bio-Formats, OMERO, IDR and their associated logos are trademarks of Glencoe Software Inc., which holds these marks to protect them on behalf of the OME community.
[ Site Map ]
Version: 2026.04.22